SuperMac Spectrum 24 PDQ+ Artifacts on Display

jmacz

Well-known member
Another month, another Spectrum video card issue :ROFLMAO: This time the card is a SuperMac Spectrum 24 PDQ+. I have reached a point debugging where I could use some additional ideas. @MacOSMonkey has been super helpful giving me lots of insight separately (thanks!!!)

Symptom:

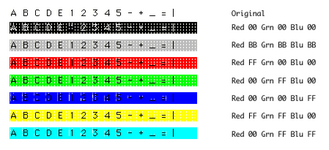
Card works great except one issue: whenever you highlight any text, the highlighted area has artifacts displayed. Image of the issue happening regardless of the color chosen for the highlight color chosen in the Color control panel.
colors2.png

Basic Debugging Done (with no change in behavior):
  • Tested in a IIci, IIfx, Quadra 700, same behavior.
  • Tested in System 7.1.1 and System 7.5.5, same behavior.
  • Tested using ROM version 1.292, 3.0, Thunder 3.1, same behavior.
  • Tested using different versions of the SuperVideo control panel, same behavior.
  • Tested on different monitors, same behavior.
  • Tested with acceleration on the PDQ+ enabled/disabled, same behavior.
  • Issue only happens in 24 bit color.
Is the issue happening during generation of the image or on its way out to display?

The above is a screenshot from the machine with the card in it. The fact that the artifacts are showing up in the screenshot suggests the artifacts are written to VRAM. So this does not seem to be an output issue (ie. not the DAC, etc).

What is the call that's causing it?

I wrote a simple program in an attempt to reproduce the issue, and I am able to reproduce 100% of the time using this program. So what is the call? It's an InvertRect call but ONLY when the HiliteMode bit is set. When this bit is set, special handling is done to utilize the selected highlight color.

The issue happens everywhere HiliteMode is used. This includes the Finder (while editing a file's name for example), in SimpleText (when you highlight text), in my test program (which actually is inverting a line of text rendered using DrawString by setting the HiliteMode bit and then calling InvertRect).

Current Test Setup
  • Quadra 700 running System 7.5.5
  • Primary Video: internal Quadra video outputting to Apple 13" monitor
  • Secondary Video: Spectrum 24 PDQ+ with Thunder ROM 3.1 and SuperVideo 3.1 outputting to a second Apple 13" monitor
Test window spanning BOTH monitors

If I have my test window spanning both monitors and invoke the call to InvertRect+HiliteMode, I see the highlighted area with no artifacts on the internal video side but I see the highlighted area with artifacts on the PDQ+ side.

Stepped Through Debugger

I stepped through what's happening inside InvertRect with MacsBug for the following four scenarios:

a.) Internal Video and InvertRect without HiliteMode set
b.) Internal Video and InvertRect with HiliteMode set
c.) PDQ+ and InvertRect without HiliteMode set
d.) PDQ+ and InvertRect with HiliteMode set


All four paths end up calling RgnBlt but diverge after that.

For paths A and B which are for the internal video, once it calls RgnBlt I see it branch and go to a very different address range and continue there. The code path taken is slightly different depending on whether HiliteMode is set. But eventually it blits the image and all is good.

For paths C and D which are for the PDQ+, once it calls RgnBlt, it stays within the same general address range as the RgnBlt. The code path taken is different depending on whether HiliteMode is set. Path C (no HiliteMode) results in the correct image. But path D (HiliteMode) causes a render with artifacts.

My assumption here is that RgnBlt has been patched with the PDQ+ present in the machine. The first few instructions in the patch RgnBlt determine whether the device is the one with the PDQ+ or not. If not, it jumps back to the original non-patched RgnBlt. That's my guess. Edit: confirmed, the call's location changes if the card is present.

Instructions Before the Artifacts Show Up

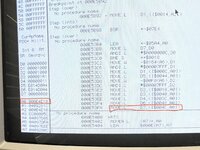
Screenshot from my phone of the instructions executed right before the artifact filled region appears on the screen. The operation in red is the one that looks like generates the blit.
IMG_8171.JPG

Current Status

At this point it looks like it's an issue in the card. This issue happens with or without acceleration but only under 24 bit color. Given acceleration does not change the behavior, I believe something's going on with the SMT-02 chip, not the SQD-01 chip.

The PDQ+ board layout and design is extremely similar to the Spectrum 24 Series IV and Spectrum 24 Series V. I have mapped out a lot of those two boards (series IV and V). Based on that mapping, I don't really see anything that would be instruction specific with regards to traces on the video card.

I would not suspect a VRAM issue as everything seems fine except for things with the HiliteMode set.

Trying to figure out what could cause a single operation (that I'm aware of) to be busted like this. Next step, look through the patched RgnBlt and see if that gives me any insight.
 
Last edited:

MacOSMonkey

Well-known member
Interesting trace. Based on the code you are showing, it looks like it could be accelerator code to me.

There are 3 possible clues:
1. D5/D6 have what appear to be Thunder/PDQ+ super-slot addresses for a card in Slot E. Is the card in Slot $E? For QD (or accelerator) operations, there is always going to be source and destination addresses in a QuickDraw transfer. And, using data registers would be the most efficient way to do the setup for an external device.
2. It must be some kind of overwrite op (like hilite, region op, etc.) because D5/D6 are the same (if they happen to be source/destination, which they probably are -- but can calculate/verify that value in your program before you attempt the operation).
3. It looks like a setup and go model. Loads a bunch of params and then executes at which point you see the failure. If the problem is happening on the MOVE D7 instruction, then that is the go command and command register, which also possibly tells you some stuff about Squid (if acceleration is running). Otherwise...?

The value in A0 could be the dCtlDriver? I think that's the right name. Or Squid offset? But, before you do the operation, you should be able to get the DCE, identify the driver location and other parameters, and check the driver location in memory to see where you are executing. You could probably also dump that in Macsbug...or make a DCMD to do it. If its not the same address, then you can subtract it to get the Squid offset in the driver.

So, given the above assumptions, looking at the MOVE instructions, the values in D1/D2 $1000 = 4096 ... suspicious for rowBytes? Again -- it would have to be source and destination. You can check that value against the pixMap.

D3/D4 might be width/height. OK -- I looked at your image and the height looks like it is 17 pixels. So...probably correct.

To Summarize:
D1: source? rowbytes
D2: destination? rowbytes
D3: width
D4: height
D5: super-slot source? address
D6: super-slot destination? address
D7: possible squid command -- then screen/artifact failure

(Generally speaking, the order follows the direction, so source first, destination 2nd. That's how it was done in the olden days. :) )

Try the same trace with acceleration turned off and see what you get. If it's QuickDraw, it will be the same. Otherwise, if you had acceleration on, then it should be different.

It doesn't look like interrupts are disabled. All you show is Supervisor mode, which is normal for legacy Mac operation. What does Int show when fully disabled? 7? I forget.

Anyway, to be sure, before you make the InvertRect Hilite call, save the SR to a data register, disable interrupts via: ori.w $#700,sr, then make the call, then restore the sr. If there is a problem with interrupts interfering with the operation, then it should go away -- just another thing to test -- may not prove anything. Maybe it's an interrupt bug? Who knows...but you can control for that. Just make sure you restore the sr, otherwise, you will be locked out.

And...one other caveat...you should try the interrupt test without breaking into Macsbug, because I think Macsbug plays games with the SR and may temporarily enable interrupts and screw up your test. I might be wrong about that...but I'm remember something about Macsbug and interrupt disable. They have to be enabled in Macsbug, otherwise, it might prove challenging to type unless it's doing its own keymap polling - actually, it might be doing that. Anyway, I forget. I'd have to look it up. It's a quick/easy test to disable and see if it affects anything.

Hope it's helpful. Good luck! :)
 

MacOSMonkey

Well-known member
I tried a bunch of different code-based HiliteMode operations (ovals, rectangles, images, patterns, etc.) on my PDQ+ with a Thunder ROM in it. No weirdness that I could see, but still have to do text. Anyway, a hardware problem seems very possible/likely. My ROM is: Thunder/24 1.6.01, Quadra 950, System 7.6.1, Board in Slot $A, SuperVideo 2.49 (but SV doesn't matter, except for capslock accel disable).

One other item for Macsbug -- you can use templates for viewing known memory structures. I forget which ones are built into Macsbug...but just type tmp <return> in Macsbug. There should be all the common ones - DCE, dCtl, pixmap, etc. I recall using them. But, if there is something missing that you need/want, you can add it to the Macsbug Prefs ('mxwt') with ResEdit. You can also try tmp <name> to see if something is defined -- like: tmp pixmap, tmp auxdce, tmp gdevice, etc. Then, just point the template at the specific memory location (or dereferenced memory location ^).
 
Last edited:

jmacz

Well-known member
Confirmed for @MacOSMonkey:
  • D1 = row bytes (4096)
  • D2 = row bytes (4096)
  • D3 = width (417 pixels)
  • D4 = height (17 pixels)
  • D5 = definitely somewhere in the slot E address space
  • D6 = definitely somewhere in the slot E address space
  • D7 = 0x80 (128) - to your point, probably the instruction for a hilite mode based invert
 

jmacz

Well-known member
Figured out a HUGE lead... but not sure I fully understand all of it.

I knew the problem existed both with acceleration and acceleration disabled. But @MacOSMonkey felt without acceleration it should not be calling the acceleration routine (within the SQD-01 chip). With the accelerated path traced, I followed up his suggestion to trace the unaccelerated path. That's when I figured out what's going on... but not 100%.

Tracing the unaccelerated path

The code follows a different path and does NOT use the patched RgnBlt. This is what @MacOSMonkey had said would be the case. How then could there be the same problem. I watched the code looping through the pixels. The cool part here is with two monitors, I can have MacsBug running on the primary and the problematic card on the second monitor. As I looped through the code, I could see the pixels being filled in one by one, row by row, in the window (without having to keep using the tilde key to pop out of MacsBug).

As I watched each pixel get rendered, I saw a "bad" one. One of the artifacts, ie. bad white ones in the screenshot I shared in the first post. Why? I had been mashing the return key to repeat step overs so I slowed down. Waited for a bad one and stopped.

Here's what it's doing:
  • Load the background color into register D3 (0x00FFFFFF) .. should be a zero followed by red, green, then blue.
  • Copy the contents of register D3 into register D4 (which then has 0x00FFFFFF).
  • Register A2 currently points at the 32bit value for the current pixel.
  • Take the long word at A2 and AND it with the contents of D4 and put the result into D4.
  • If the result is the same as D3, it's the background so paint the hilite color on that pixel.
  • If the result is NOT the same as D3, skip this pixel.
Simple logic.. which means.. the background is not completely white when it should be! When I have an artifact, the comparison fails because the blue component (the least significant 8 bits) is incorrect. I wanted it to be 0x00FFFFFF (pure white) but I am seeing 0x00FFFFF0 and other values!

So it is NOT the accelerated inversion code with HiliteMode set... it's not the inversion code at all. It's actually that the source is not entirely uniform.

I took various screenshots of the window area in question:

picture1.png

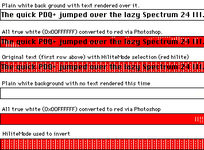
The first row is a screenshot prior to any highlighting, etc. The second row is me going into photoshop and for every pixel that is fully white (0x00FFFFFF), I forced the color to red. As you can see, there's artifacts already even prior to invert+hilitemode. The third row is with the invert+hilite. The fourth/fifth/sixth rows are the same without the text -- I tried this to figure out whether the issue is with DrawString() or whether it's occuring for pure white backgrounds. But clearly it's happening everywhere.

What is weird though is I would have expected row 2 and 3, as well as row 5 and 6 to be the same! ie. all non-white pixels are left alone using the invert+hilitemode but that's not the case either. This doesn't make sense to me. I then thought perhaps the noise was changing on its own? But that's also not the case. The non-white pixels are consistent over the duration of my testing and the invert+hilitemode always results in the same thing also. Huh?

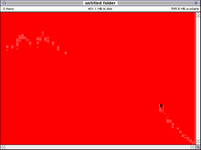
I then created a new folder in the Finder and made it fill the entire second screen and took a screenshot. Then again filled in all the pure white pixels as red to easily see the non-white ones:

Picture2.png

Even in this blank window, it's not all white. Note that I only converted to red in the window content area but the title bar, scroll bars, all of it has the same issue. But here's another clue, clearly the bad pixels at least in this window have occurred following the mouse cursor?

Learnings from these experiments today:
  • Doesn't seem to be the SQD-01 chip that handles accelerated functions.
  • Doesn't seem to be the invert+hilite mode call anymore.
  • Seems to be tied to the blue channel which based on my prior tracing seems to reduce the problem area to 8 of the 24 VRAM chips.
  • Doesn't seem to be an entirely faulty VRAM chip as it's not across the entire screen.
  • Seems to be every 4th pixel column.
Seems like a faulty read from one of the blue VRAM chips but I'm lost as to why the invert+hilitemode vs the bad white pixels doesn't match up properly as I mentioned earlier.
 

joevt

Well-known member
Software cursor or hardware cursor? A hardware cursor shouldn't affect the screen pixels in VRAM.

What method is being used to take a screenshot? Doesn't taking a screenshot usually hide the cursor first? Unless that's only true for hardware cursor.
 

jmacz

Well-known member
Screen shot was taken with Command-Shift-3 (built in mechanism).

I'm actually not sure I know the difference between a software cursor vs hardware cursor?
 

Arbee

Well-known member
A software cursor is drawn by the Mac into the frame buffer, replacing whatever was there until you move it. A hardware cursor is overlaid on the screen but isn't ever actually in the frame buffer. As far as I'm aware none of these cards had a hardware cursor.
 

jmacz

Well-known member
I see. Well it looks like the software is in the frame buffer so sounds like it's a software cursor.
 

MacOSMonkey

Well-known member
Macs have soft cursors that are updated on a vbl task (during blanking/interrupt time). They do not replace what is on screen, but rather do a copy OR after saving the cursor region. Cursor functionality is part of the OS and is not specifically linked/associated with video cards, except to the extent that cards and/or software/apps may modify cursor appearance/behavior/updates - like hand panning and quick panning on SuperMac cards with SuperVideo installed.

Hardware boxes with cursors, blending, effects, etc. - like the Quantel PaintBox and Chyron text generators - took multiple sources in and the rendered them with hardware effects, text, etc. and then output the resulting/combined broadcast video signal.

It was possible to do genlock and chroma-keying on early Spectrum/8 boards and System 6.0.x by using a Julian Systems board and a special version of SuperVideo that could "slurp" a background color (including with a slurping sound) as the chromakey color. This version of SuperVideo changed the cursor to an eye dropper. I think it also had a funny dialog when it couldn't detect a board. It said something like: "No SuperMac video card detected." and the button said "But I SEE one!" :D Quite amusing...but maybe not for the user.

Digital Film also had some hardware-based features - but mostly full frame rate capture and some prosumer stuff to compete at the low-end with Avid -- ca. 1991-92 and the Seybold Conference, right before Adobe bought Premiere from SuperMac.

Anyway - skip all the highlight stuff. Get the frame buffer specs from CQD and write a video RAM tester to look for specific failures. Could be bad RAM or stuck/floating lines. I know you have done testing to try to rule out RAM, but maybe a dedicated test would help.

Also, see what happens when you disable interrupts - that will definitely stop cursor interference. Probably won't matter, but just another data point.
 

jmacz

Well-known member
Also, see what happens when you disable interrupts - that will definitely stop cursor interference. Probably won't matter, but just another data point.

Added assembly before and after the InvertRect call to disable and then restore interrupts. Didn't help unfortunately.
 

jmacz

Well-known member
Anyway - skip all the highlight stuff. Get the frame buffer specs from CQD and write a video RAM tester to look for specific failures. Could be bad RAM or stuck/floating lines. I know you have done testing to try to rule out RAM, but maybe a dedicated test would help.

Yeah, will spend some time tomorrow writing some tests with the framebuffer and see what I get.
 

MacOSMonkey

Well-known member
re: interrupt disable -- good. It shouldn't matter, as above, but just ruling it out. So, you know you are dealing with an issue that is explicitly affecting the blue component of the data path without any outside interference.

Parenthetically, in the case of SuperMac graphics acceleration, interrupts are disabled during transfers to prevent the cursor from screwing things up or leaving artifacts behind.
 

jmacz

Well-known member
Wrote some test routines today that directly manipulate the VRAM (via the base address provided through the gdevice pixmap info). I am basically writing to it and reading from it to confirm what I wrote is actually there. And I know it's working as I can see exactly what I'm writing on my second monitor.

Basic tests so far:
  • Fill screen resolution with white and go back and check.
  • Fill screen resolution with red and go back and check.
  • Fill screen resolution with green and go back and check.
  • Fill screen resolution with blue and go back and check.
  • Fill full rowBytes with white and go back and check.
  • Fill full rowBytes with red and go back and check.
  • Fill full rowBytes with green and go back and check.
  • Fill full rowBytes with blue and go back and check.
  • All of the above with large BlockMoves instead of pixel by pixel writes.
For the write and then verify cycles, I added a delay between the write and the read. This delay is 5 seconds AND during those 5 seconds, I am NOT locking up the machine, I am calling WaitNextEvent and handling events during this time. I did this on purpose to let other things execute in case something else is coming in and screwing with the frame buffer.

Unfortunately, NONE of the above is able to reproduce the issue.

UNTIL... I moved my mouse onto the second monitor.
  • Filled screen with white.
  • Ran verifier which confirmed all bits are good.
  • Moved my mouse partially onto the left edge of the second monitor.
  • Ran verifier which confirmed pixels where the mouse went over are no longer good.
Did the same as the above on my main monitor and the mouse does not cause the same issue. Everything's good on the main monitor/video.

Screenshot... steps:
  • Filled screen with white directly writing into the frame buffer.
  • Took first screenshot and filled all TRUE WHITE in red.
  • Moved mouse over left edge of monitor.
  • Took second screenshot and filled all TRUE WHITE in red.
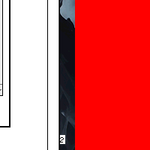
Before Mouse (everything is white)

pic1.png

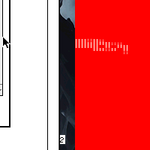
After Mouse (path has artifacts)

pic2.png

Again, looks like every 4 pixels. I believe the way these cursors are drawn, it's essentially an XOR. Looks like for whatever reason, the XOR isn't working quite right?

I took a look at what the pixel data showed in two tests:
  • 1st Test: Fill screen with white
    • Pixels should be all white: 0x00FFFFFF
    • After mouse passes over, the bad pixels are: 0x00FFFFF0
  • 2nd Test: Fill screen with red
    • Pixel should be all red: 0x00FF0000
    • After mouse passes over, the bad pixels are: 0x00FF000F
Looks like the XOR on the least significant 4 bits of the blue channel is not working quite right.

This issue is consistently reproducible which suggests to me that it's not some noise issue. It's possible it's not a blue channel issue either -- but possibly an issue with the operation on the least significant 4 bits of a value.

I had tried PaintRect or FillRect (can't remember which one) with the appropriate xor mode before and did not see this issue. Need to go back and take a look again.
 

jmacz

Well-known member
It looks like the issue is with XOR operations. I ran some new tests and it's definitely seeing an issue after an XOR is done. I must have visually inspected the results last time when testing with XOR so I missed it as it's subtle.

Test Scenario
  • Create a new window (so that I can utilize stock QuickDraw XOR functions).
  • Calculate screen coordinates of the window's port rect.
  • Directly fill the frame buffer for the window's contents with pure white.
  • Verify those pixels are pure white (all good here).
  • Use quick draw operation (used both PaintRect with patXor and also tried InvertRect) to invert the window contents.
  • Verify directly from the frame buffer whether all pixels are pure white (bad result here).
Again, it's every 4th pixel column and it's the lowest 4 bits of the blue value which is bad.
 

jmacz

Well-known member
Wrong again 🤬 I got so tied up with HiliteMode initially that I've been stuck thinking about things associated with it, hence most recently XOR operations. But it's not that either because I just implemented an iterative XOR in software (to rule out any special handling of XOR in the hardware) and I see the same issue... which then led me to just do simple writes/reads and I'm seeing issues there as well (but not in all cases).

Latest
  • Indeed is the least significant 4 bits of blue.
  • In fact, it's actually the 2nd bit (ie. 0x00000002).
  • Every 4th pixel in my blit is having this issue.
  • BUT there are cases where it doesn't happen, for example all black, all white, some other patterns.
It's probably a function of another bit either in the value or in the address (the fact that it's every 4th pixel suggests it's an address line) so looking for that pattern now. But looks like I have damage to one of the 8 blue associated VRAM chips on the board. I'm going to assume now that at least in 24 bit color, it's 1 bit of blue per chip.
 

joevt

Well-known member
If there's a VRAM problem, then there would be issues more visible with 1,2,4,8 bit color? Or does the card only do 24 bit color?
 

jmacz

Well-known member
The card does support all of those bit depths but I only see the issue on 24 bit color. I'm not quite sure how SuperMac utilizes the VRAM chips in each bit depth but from mapping out the card:
  • Group of 8 "red" VRAM chips, all wired to talk only to the "red" BSR chip, which is wired to only the 8 red pins on the RAMDAC
  • Group of 8 "green" VRAM chips, all wired to talk only to the "green" BSR chip, which is wired to only the 8 green pins on the RAMDAC
  • Group of 8 "blue" VRAM chips, all wired to talk only to the "blue" BSR chip, which is wired to only the 8 blue pins on the RAMDAC
In 1 bit mode (B&W), I see only the 8 "red" VRAM chips being utilized. I've tried shorting the green and blue chips' outputs and none of them affect the screen while in B&W, only shorting the red chips' outputs do.

After spending time running various additional tests, I have narrowed it down to:
  • Bits 2, 3, and 4 of the blue component are the ones that sometimes have issues, none of the other bits are showing problems.
  • None of these 3 bits have issues when outputting a stream of the same color. ie. all black, all white, all blue, all green, all red, etc don't exhibit the problem. These 3 bits don't have to be the same, just if they stay consistent across pixels, they seem to do ok.
  • If it's not a stream of the same pixel value (eg. randomize the pixels), then some combination of those 3 bits get the wrong state.
  • Haven't figured out what the pattern is yet.
  • But it's consistently the same addresses having issues (every 4th column) so it could be 1 or 2 of the VRAM chips have some problem.
I should be able to use my logic analyzer or quick and dirty shorting to figure out which of the VRAM chips is responsible for the pixels I am having issues with. From there, hopefully make some progress on whether it's the address lines going into the chip or the chip itself.

OR I could be heading down the wrong path again. We'll see.
 

cheesestraws

Well-known member
This is a fun one. Don't have much to add that you're not already covering yourself, but I'm enjoying your troubleshooting process!

If you write a short program to mimic the behaviour of the mouse cursor redrawing code in the ROM, does it exhibit the same artefacts? i.e. is it something that's appearing exclusively in an interrupt context or can you trigger it from 'normal' execution?
 
Top