Some insights:
- the L2 cache is (as expected) not split. Data can use all of the 256kB.
- I have not checked N-way yet (I think allocating 2x128kB, write both, and then read interleaved from both would tell if it is N-way)
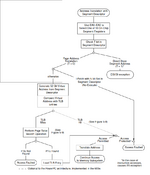
How I approached the micro benchmark:
- this is on a 5200 with 8kB data L1 cache and 256kB L2 cache
- I use "tb" (ticks every 8 cycles), I wait for tb to tick and then I measure a load and immediately after measure tb again.
- I allocate memory (aligned to page 4kb), I write 512kb of data (in a reversed way, from last position to offset 0)
- I use a load to measure cache access, I use a stride multiple (8) of block size (32) = 32*8 (so no load will benefit from a previous load)
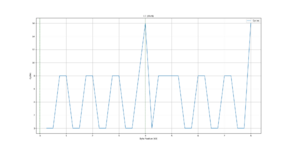
- I read the last memory written (most of this will thus be in L1, but e.g. stack will pollute a bit), in plots, this is 0kb to 8kb
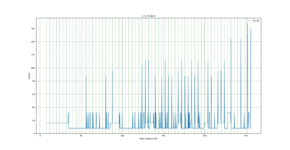
- I then read the memory from 8kb to 256kb, this has a high chance of being in L2, but L2 is shared by instructions as well, and any interrupt can severely modify the data in L2.
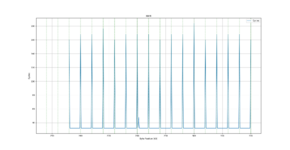
- finally I read 256kB to 512kB, this will be in ram (not L1/L2)
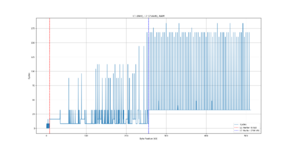
plots is all from same data but showing different areas (byte positions that was loaded), tables.csv (first column is the byte position, and second column is the # of cycles).
Details:
- as expected, it is not a split-cache, i.e. data can be used in all of the 256kb
- L1: I only have 8 cycle resolution, specs says 2 cycle throughput and 2 cycle latency => 0 is really ~2 cycles (tb did not have time to tick), 8 is when it must go fetch in L2
- L2: takes 8 cycles when is in L2, we can see these spread out all over L2, indicating that the data can be placed anywhere (it is not a split cache).
- RAM: we can see when not in L2 best case is 32 cycles, this is both due RAM being slower but also because it is on a 32 bit bus (L1/L2 is 64 bit). It also takes ~168 cycles worst case, and we can see how this happens on 4kB (page) boundaries. So on a miss, something happens to make accesses within that page faster (it is not in L2, but it might be the MMU page entries that helps or maybe the memory controller has a buffer?).