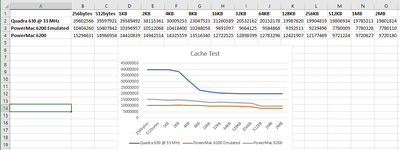
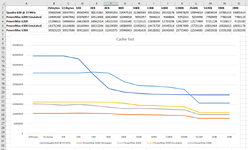
Testing a 6200 and comparison with 6100

The 040 bus clock is definitely going to be a multiple of the PPC clock... anything else makes the bus adaptation logic much more complicated than it already must be. As Phipli said apple almost certainly specified the ASIC for operation at 40mhz speeds but what configuration (ie. Programmable wait states) is required to support that remains to be seen. Again recommend referencing the memc documentation for some examples of how different DRAM grades work into 040 bus cycle timing. Something like 4-2-2-2 is more likely; 2-1-1-1 is the minimum cycle and difficult to achieve.

The 60mhz clock would be for the valkyrie private framebuffer DRAM only; that being uncoupled from the bus clock would be normal and expected. Similar to what the Epson chip on my 30video cards does, this should run as fast as practically supported by the DRAM in order to maximize bandwidth.
 
Hi folks,

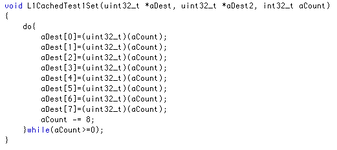
OK, I've written the test application. It's not very big. Source code and application are included. The results take a bit of interpreting.

My PB1400c is a 603e Mac (as we all know). So, it has a 4-way x 16kB, Write-back L1 Cache. It also has a 128kB L2, Write-Through cache. So, I need to test up to "8 sets" in my test to force a flush to L2 (which also forces a flush to what's called the I/O bus on the PB5300/PB1400, which is kinda equivalent to the '040 bus on the 6200). Hence my version of the application is different to the one for the P5200/6200.

Mine's also written in CW11 Gold, I don't know how easily that converts to the later versions people tend to use. Here are my results and my interpretation of them:

TestTicks/LoopTicksRemCountBandwidth (MB/s)
1Set1298489357871134217728134217728*4/1048576/((93+(129848-57871)/129848)/60)=328MB/s
2Sets129738969139134217728134217728*4/1048576/((96+(129738-9139)/129738)/60)=317MB/s
4Sets1294219895702134217728134217728*4/1048576/((98+(129421-95702)/129421)/60)=313MB/s
8Sets129780627776120971522097152*4/1048576/((62+(129780-77761)/129780)/60)=7.69MB/s

So, what we see here is a demonstration of how great L1 cache is and the dramatic difference between L1 cache memory and the main I/O bus on a PB1400C. But are the L1 cache values realistic? Well, the PB1400c runs at 166MHz. 328MB represents 82M x 32-bit writes/s, equivalent to about 2 cycles per store instruction, which is probably correct. It also looks like there's a slight penalty for accessing different sets, which is interesting.

And my guess, is that the poor main RAM performance is because the PB1400c's bus is just 32-bits and uses pseudo-static RAM. 7.69MB/s is 1.9M 32-bit bus cycles per second for an average of 520ns per bus cycle. I mean, that's bad huh?

The version supplied will go through up to 8 sets and wait for you to press the mouse button. When you do, it'll check the Valkyrie VRAM test, writing directly, as I believe, to the VRAM addresses beginning at $F9000000. And this could be totally wrong, because for all I know those are its I/O regs so it'd be a major disaster ( @noglin ... are the I/O regs there or the screen memory itself). Perhaps I should just take the address of ScreenBits, then it would also work for my Mac. So, it's probably best to Restart the Mac instead of pressing the mouse button the first time, i.e. don't even press the mouse button once, just perform a physical Restart. The next version will have a real event loop, not a wait for Button()!.

I intend to build and submit a version that should work for the 630 at some point too. Still, this version should be useful for comparing your P6200 with my PB1400.
 

Attachments

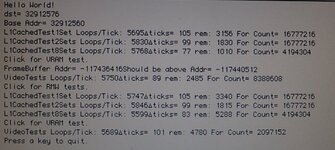
For your delight, I've updated the very crude app to support writing directly to the framebuffer. I did it by dereferencing the Pixmap handle from the CGrafPtr for screenbits. This version of the app should therefore work with a P6200 and if recompiled, for a P630.

TestTicks/LoopTicksRemCountBandwidth (MB/s)
VRam129758603744620971522097152*4/1048576/((60+(129758-37446)/129758)/60)=7.9MB/s

It's pretty much as slow and I'm still fairly surprised about that. The UI is still pretty awful, it does the first 4 tests and tells you to click, then it does the video test and then you need to click to finish.

68K version coming up in a few hours (it's written, but must dash).
 

Attachments

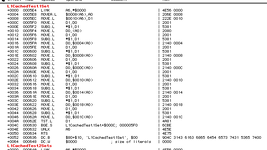
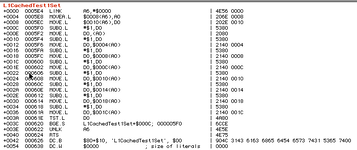
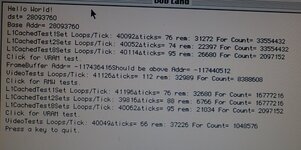
And finally, the 68K version! These are the results I get for that:

Mc040BusTest68K.jpg
For 68K version running on my PB1400, I get slower results.

TestTicks/LoopTicksRemCountBandwidth (MB/s)
L13640287155626710886467108864*4/1048576/((87+(36402-15562)/36402)/60)=175MB/s

I've just included the normal L1 calculation, because the other calculations that fit in cache are basically the same. It's pretty good, 175MB/s is 53% of the performance of the PPC version. I didn't optimise for 68020, because on a 68040, 68000 is probably faster and I didn't have an '040 optimisation option.

We can guess what the performance of a 6200 for the 1 and 2 sets tests will be. It ought to be simply be 75/166=148MBs, a bit slower than my 68K emulated version! The VRAM test did actually affect my screen, so I think it was a correct mapping! And it ought to be uncached too, because it's using the actual VRAM addresses.

Let me know your test results :-) .
 

Attachments

@Phipli , @zigzagjoe , @noglin , [at] anyone else with a 630/5200/6200 or comparable era Mac.

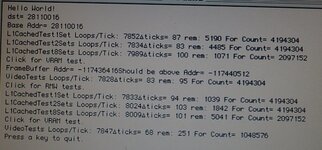
I've updated the tests to include RMW tests, which operate on whole words to add the current loop countdown to a given word. I think that's as valid as operating on bytes. I removed the 4 Sets test because a 603 and 603e will both flush L1 cache lines in the same way for an 8 Sets test. Here are my new PPC results:


TestLoops/TickTicksRemCountBandwidth (MB/s)
1Set1196609364898134217728134217728*4/1048576/((93+(119660-64898)/119660)/60)=328MB/s
2Sets1238899627947134217728134217728*4/1048576/((96+(123889-27947)/123889)/60)=317MB/s
8Sets12368362912402097152134217728*4/1048576/((62+(123683-91240)/123683)/60)=313MB/s
VRAM123997603978520971522097152*4/1048576/((60+(129780-39785)/129780)/60)=7.69MB/s
1SetRmw1240237144616710886467108864*4/1048576/((71+(124023-4461)/124023)/60)=213MB/s
2SetsRmw123541101953896710886467108864*4/1048576/((101+(123541-95389)/123541)/60)=151MB/s
8SetsRmw124028629020620971522097152*4/1048576/((63+(124028-90206)/124028)/60)=7.59MB/s
VRAM1240086466410485761048576*4/1048576/((64+(124008-664)/124008)/60)=3.69MB/s

And here are the results compiled for the 68K version.

TestLoops/TickTicksRemCountBandwidth (MB/s)
1Set3587688200236710886467108864*4/1048576/((88+(35876-20023)/35876)/60)=174MB/s
2Sets3593075353556710886467108864*4/1048576/((75+(35930-35355)/35930)/60)=205MB/s
8Sets35888622793720971522097152*4/1048576/((62+(35888-27937)/35888)/60)=7.71MB/s
VRAM35907601191120971522097152*4/1048576/((60+(35907-11911)/35907)/60)=7.91MB/s
1SetRmw3592069206823355443233554432*4/1048576/((68+(35920-20682)/35920)/60)=112MB/s
2SetsRmw3546472180353355443233554432*4/1048576/((72+(35464-18035)/35464)/60)=106MB/s
8SetsRmw35738622797120971522097152*4/1048576/((62+(35738-27971)/35738)/60)=7.71MB/s
VRAM3591464174710485761048576*4/1048576/((64+(35914-1747)/35914)/60)=3.70MB/s

As we can see, RMW performance in most cases (apart from 8Sets) is about half the speed of simply writing to memory; main memory speeds are shockingly slow; RMW for main memory, oddly enough is the same speed on my system; 68K performance is about half that of native PPC performance (impressive, and implies that the branch unit really has an effect); VRAM RMW is half the speed of VRAM Write, which is what I'd expect from the system diagram, since VRAM simply hangs off the IO bus and is directly accessed rather than going into a graphics chip buffer as you might expect for Valkyrie.

A word about the timing mechanism. I have just used TickCount() for my timings and use a simple technique to improve the timing resolution. I first time the number of simple counter loops I can do per tick; then it repeats { wait until TickCount() changes and immediate perform the test, measure the number of counter loops it can do before TickCount() changes [the remainder]; then double the number of loops in the test } until the test takes at least 1s. The synchronisation step and remainder steps give my calculations a higher resolution. The variation in the Loops/Tick represents OS overhead variations, about 1%. I run my tests with VM on as it happens. This means my timing resolution is about 0.17ms vs 17ms.

Both the PPC and 68K applications and source projects are attached. As discussed earlier, I would expect PPC6200 set tests to be 148MB/s for 1 and 2 sets, but I'm hoping the 8 sets tests will be better than 7.71MB/s. The objective really is to try and determine if the PPC6200 '040 bus speed is more likely to be 25MHz, 33MHz or 37.5MHz. This is not really possible if memory bandwidth is limited by DRAM speeds rather than the PPC/'040 bus interface. My thinking, oddly enough is that if it's 25MHz, then DRAM test performance will be comparable between the 630 and 6200 (because it's limited by the DRAM cycle time), but VRAM test performance on the 630 will be relatively better than DRAM test performance on the 6200 (because the 4 transaction buffer on Valkyrie will be limited by the bus speed rather than DRAM).

Having said that, I might need to change my tests, because my tests certainly write more than 4 transactions in one blast (they write millions). I really would want to write 4 words, then perform a long enough delay to allow a transaction buffer to clear so I'm really not testing the VRAM write performance either. Hmmm.


Let me know how the tests go for you.
 

Attachments

Last edited:
Back
Top